
Page 205 - flipbook-ubp-IR
P. 205
OUR CORPORATE PERFORMANCE GOVERNANCE
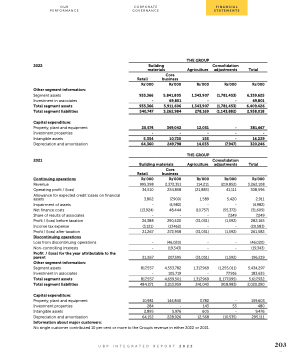
2022
Other segment information:
Segment assets Investment in associates Total segment assets Total segment liabilities
Capital expenditure:
Property, plant and equipment Investment properties Intangible assets
Depreciation and amortisation
2021
Continuing operations
Building materials
THE GROUP
Agriculture
Rs’000
1,343,907 -
1,343,907
278,169
12,051
-
155
14,035
THE GROUP
Agriculture
Rs’000
114,211
(21,883)
1,589 - (10,757) -
(31,051) -
(31,051)
-
-
(31,051)
1,317,969 -
1,317,969
241,043
Consolidation adjustments
Rs’000
(1,781,453) -
(1,781,453)
(1,143,882)
-
-
-
(7,947)
Consolidation adjustments
Rs’000
(219,852)
41,111
5,420 - (55,372) 7,249
(1,592) -
(1,592)
-
-
(1,592)
(1,255,011) 77,916
(1,177,095)
(918,983)
-
53
-
(10,535)
Total
Rs’000
6,339,625 69,801
6,409,426
2,938,018
381,667
-
16,229
320,246
Total
Rs’000
3,262,108
308,596
2,911 (4,982) (31,609) 7,249
282,165 (20,583)
261,582
(46,020)
(19,343)
196,219
5,434,297 183,635
5,617,932
2,020,290
159,603
480
9,476
295,111
Retail
Rs’000
935,366 -
935,366
540,747
20,574
-
5,354
64,360
Core business
Rs’000
5,841,805 69,801
5,911,606
3,262,984
349,042
-
10,720
249,798
Building materials
Retail
Rs’000
Core business
Rs’000
2,372,351
254,858
Revenue 995,398
Operating profit / (loss) 34,510
Allowance for expected credit losses on financial
assets 3,802
Impairment of assets
Net finance costs
Share of results of associates
Profit / (loss) before taxation
Income tax expense
Profit / (loss) after taxation
Discontinuing operations
Loss from discontinuing operations
Non-controlling interests
(7,900) - (4,982) (13,924) 48,444 - -
24,388 290,420 (3,121) (17,462)
21,267 272,958
- (46,020)
- (19,343)
Profit / (loss) for the year attributable to the
parent 21,267
207,595
4,553,782 105,719
4,659,501
2,213,959
Other segment information:
Segment assets Investment in associates Total segment assets Total segment liabilities
Capital expenditure:
817,557 -
817,557
484,271
Property, plant and equipment
Investment properties
Intangible assets
Depreciation and amortisation
Information about major customers:
No single customer contributed 10 per cent or more to the Group’s revenue in either 2022 or 2021.
10,981
284
2,895
64,152
144,840
-
5,976
228,926
3,782
143
605
12,568
UBP INTEGRATED REPORT 2022
203
FINANCIAL STATEMENTS
