
Page 182 - flipbook-ubp-IR
P. 182
INTRODUCTION ABOUT US MANAGEMENT APPROACH
NOTES TO THE FINANCIAL STATEMENTS
FOR THE YEAR ENDED JUNE 30, 2022
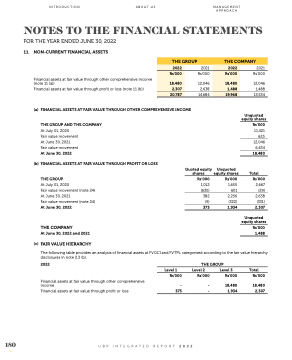
11.
NON-CURRENT FINANCIAL ASSETS
Financial assets at fair value through other comprehensive income (note 11 (a))
Financial assets at fair value through profit or loss (note 11 (b))
(a) FINANCIAL ASSETS AT FAIR VALUE THROUGH OTHER COMPREHENSIVE INCOME
THE GROUP AND THE COMPANY
At July 01, 2020
Fair value movement At June 30, 2021
Fair value movement At June 30, 2022
(b) FINANCIAL ASSETS AT FAIR VALUE THROUGH PROFIT OR LOSS THE GROUP
At July 01, 2020
Fair value movement (note 24) At June 30, 2021
Fair value movement (note 24) At June 30, 2022
THE COMPANY
At June 30, 2022 and 2021
(c) FAIR VALUE HIERARCHY
Quoted equity shares
Rs’000
1,012 (630)
382 (9)
373
Unquoted equity shares
Rs’000
1,655 601
2,256 (322)
1,934
2021 Rs’000
12,046 1,488 13,534
Unquoted equity shares
Rs’000
11,421 625 12,046 6,434 18,480
Total
Rs’000
2,667 (29)
2,638 (331)
2,307
Unquoted equity shares
Rs’000 1,488
The following table provides an analysis of financial assets at FVOCI and FVTPL categorised according to the fair value hierarchy disclosures in note 2.3 (b).
2022
Financial assets at fair value through other comprehensive income
Financial assets at fair value through profit or loss
THE GROUP
Level 1 Level 2 Level 3
Rs’000 Rs’000 Rs’000
- - 18,480 373 - 1,934
Total
Rs’000
18,480 2,307
180
UBP INTEGRATED REPORT 2022
THE GROUP
2022
2021
THE COMPANY
2022
Rs’000
18,480
2,307
Rs’000
12,046 2,638
Rs’000
18,480
1,488
20,787
14,684
19,968
