
Page 179 - flipbook-ubp-IR
P. 179
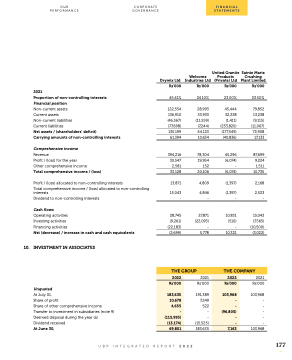
OUR CORPORATE PERFORMANCE GOVERNANCE
 2021
Proportion of non-controlling interests Financial position
Non-current assets
Current assets
Non-current liabilities
Current liabilities
Net assets / (shareholders’ deficit)
Carrying amounts of non-controlling interests
Comprehensive income
Drymix Ltd
Rs’000
45.41%
122,554 136,910 (46,567) (77,698)
135,199
61,394
Welcome Industries Ltd
Rs’000
24.10%
28,993
33,933 (11,559) (7,244)
44,123
10,634
78,304
19,954 152
20,106
4,809
4,846 -
27,871 (22,093) -
5,778
United Granite Products (Private) Ltd
Rs’000
23.00%
45,444 32,238 (1,411) (253,820)
(177,549)
(40,836)
45,296
(6,074) -
(6,074)
(1,397)
(1,397) -
10,831 (510) -
10,321
Sainte Marie Crushing Plant Limited
Rs’000
23.50%
79,852 13,238 (9,115)
(11,067)
72,908
17,133
87,699
9,224 1,511
10,735
2,168
2,523 -
15,043
(7,565) (10,500)
(3,022)
2021 Rs’000
103,968 - - - - - 103,968
                    Revenue 394,216
 Profit / (loss) for the year
Other comprehensive income
Total comprehensive income / (loss)
30,547 2,581
33,128
          Profit / (loss) allocated to non-controlling interests
13,871 interests 15,043
Total comprehensive income / (loss) allocated to non-controlling Dividend to non-controlling interests
Cash flows
Operating activities
Investing activities
Financing activities
Net (decrease) / increase in cash and cash equivalents
10. INVESTMENT IN ASSOCIATES
Unquoted
At July 01,
Share of profit
Share of other comprehensive income Transfer to investment in subsidiaries (note 9) Deemed disposal during the year (a) Dividend received
At June 30,
-
28,745
(9,261) (22,183)
(2,699)
                    THE GROUP
2022
(115,993)
(13,174)
-
2021
THE COMPANY
2022
   Rs’000
183,635
10,678
4,655
Rs’000
191,389 7,249 522 - - (15,525)
Rs’000
103,968
(96,805)
-
-
-
-
   69,801
183,635
7,163
             UBP INTEGRATED REPORT 2022
177
 FINANCIAL STATEMENTS
